

Truth No. 10: "Lies, damned lies, and statistics"... even in investing
By Mike Jones, posted September 18th, 2014
Most people think of investing as a personal activity that directly impacts their individual future. However, most of what we are taught is really only applicable to investors en masse, i.e. the market-at-large, and over large periods of time. This month's column brings us to the tenth and final point that I believe every investor should know prior to committing funds to any investment program.
Attributed to British Prime Minister Benjamin Disraeli and popularized by Mark Twain, this quote describes the persuasive-and sometimes downright manipulative-nature of the presentation of some numbers and statistics.
Unfortunately, the practice of manipulative math is just as readily found in investing as it is in other statistical sciences.
For me, perhaps the most glaring example of misrepresentative statistics in financial marketing literature is the publication of the simple average of a highly volatile stock when the compounded average may paint a very different picture.
In the example below you can see that the simple average of several years of returns shows a 7.1% average return while the compounded annual average returns a more conservative 4.8%.
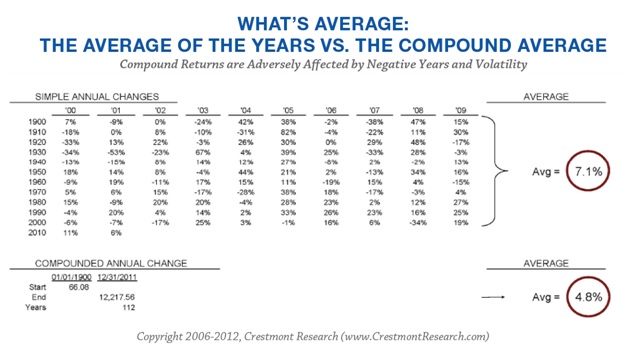
Don't let all of these numbers scare you away! What is illustrated above is one of the most important concepts you will ever learn as an investor. Let's discuss the two approaches.
The first is a simple arithmetic average. To arrive at 7.1%, you simply add up the entire set of numbers and then divide by the total number of percentages given.
Simple averages are completely valid and mathematically correct, but they can be very misleading. Let's say you have $100 and lose 50% of it. You now have $50. But then the next year you gain all of your loss back. You now have your initial $100 and most of us would agree that you haven't made any money. However, the simple average paints a different picture. In the first year you experienced a 50% loss, but, because you made back $50 the second year, your return that year is technically 100%. Average the two (-50 and +100) and you average 25%. Nice average, but in reality you know you only have the same amount of money with which you began, which feels like (and is) a real return of 0%.
We get a 0% average using the second method, the compounded annual change. A compounded return is the interest rate at which your funds actually grew year in and year out, making it the number that you are more likely to have interest in and the number you probably want to use when you plan for your financial future.
NEWS FLASH!!! The compounded annual percentage is typically not the number that the financial community shares, especially when promoting volatile and aggressive investments. As in the example shown above, the 7.1% simple average is far more appealing than the 4.8% compounded return. For sure, both are mathematically correct, however one is obviously slightly more enticing... and misleading.
This, of course, is why after 30 years in this business I am attempting to help investors set more realistic expectations and achieve modest, consistent returns.
Read the fine print. Understand that the numbers in marketing literature can sometimes be misrepresented truths. And feel justified being skeptical if the numbers seem too good to be true.
Mike Jones is Managing Director / Investing Group of Argent Advisors, Inc. Email him at mjones@argentadvisors.com. Write to him at 500 East Reynolds Drive, Ruston, LA 71270 or call him at (318) 251-5844. The opinions of any single advisor do not necessarily reflect the opinions of Argent Advisors, Inc. No forecasts can be guaranteed. Argent Advisors, Inc. does not offer tax, insurance or legal advice. The information contained in this column should not be construed as a substitute for personalized investment, tax, insurance or legal advice.
Have you met our team?
We have a wealth of experience
in the financial services industry.
