

Investing Truth No. 3: Every investor needs a trend in order to make money
By Mike Jones, posted November 15th, 2013
Most people think of investing as a personal activity that directly impacts their individual future. However, most of what we are taught is really only applicable to investors en masse, i.e. the market-at-large, and over large periods of time. Over the next several months I will share 10 points that I believe every investor should know prior to committing funds to any investment program.
One of the oldest sayings in the investment world is "the trend is your friend." Every investor needs a trend in order to make money.
Here's why.
A market is simply a place where buyers and sellers come together to exchange goods. And the securities market is no different. It is nothing more than a place where buyers and sellers participate in an auction for ownership of various companies (stocks) or the ownership of loans made to various entities (bonds). (These days, esoteric versions and hybrids of these securities also exist, but most of the activity at the daily auction is for stocks and bonds.)
So why would people want an auction to exchange stocks and bonds? An auction provides different benefits to different investor groups. For short term investors (we like to call them what they really are-SPECULATORS) a daily auction provides a place to play. For normal investors, a daily auction provides liquidity. It also delivers "price discovery" because on any given day an investor knows what the market is saying about the value of a given security.
When a stock or bond is trending up (i.e. the price is going up), one must assume that there are more buyers in the auction than sellers and that there is optimism about the financial future for that particular asset. Logic dictates that some people who purchased it for less than the current value are selling in order to capitalize on that gain. The buyers, on the other hand, are purchasing on the belief that the instrument's value will continue to increase and they will be able to capitalize on the gain sometime in the future.
When a market is down-trending (i.e. prices are going down), some holders of a particular instrument decide to sell to reduce further loss of their capital. Others are purchasing at this time because they may believe that the instrument will rebound in the future and they will then be able to realize a gain on their investment.
If a stock purchased for $100/share were to always remain at $100 there would be no opportunity to profit. Investors rely on higher prices occurring somewhere down the road to create value. So, as you can see, trends are precisely why investors invest. So, no ifs, ands or buts about it, in order to be a successful investor you really must have a healthy respect for trend analysis.
But you must practice the right kind of analysis.
I have to smile when I watch the evening news. When reporting on market movements, it seems news outlets must have a reason for what the market did on any particular day, even if nothing significant occurred that day. For example, one day recently the broader stock market was down just 0.1% (that's one tenth of one percent!), and the headline from one of the major networks was that the market decline occurred because of concern about sluggish economic growth... to which I say, no they weren't!!! There just happened to be more sellers in the market that day than there were buyers.
But observing market movements over a broader period of time-true trend analysis-is not only more relevant, it's also incredibly fascinating. One of the mast common measures of trend analysis involves the 200 day simple moving average (SMA) of an asset, particularly the 200 day SMA of the US stock market.
The SMA of an asset is calculated by averaging the daily closing price of an asset by any particular number of market days, 200 in this case. Then, every day the oldest day is deleted from the calculation and the latest day is added to the calculation. Whenever that asset is trading above that average it is considered to be in an up-trend and whenever it is below that average it is considered to be in a down-trend.
As you can see in the chart below, for the time period from July, 1929 to April, 2009, for all of the days that the market was up-trending, it delivered an annual return of 10.56%.
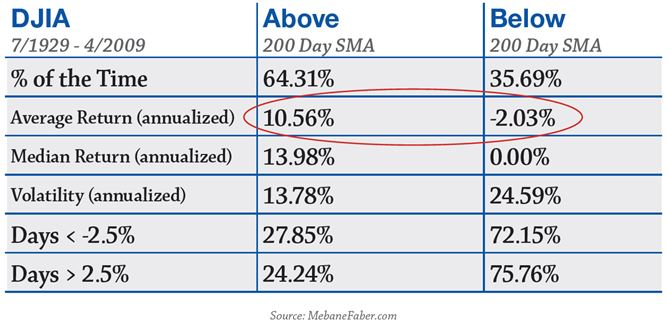
Stated another way, investors seem to have a much greater chance of making money when markets are trending above their 200 day moving average.
Conversely, when markets are trending below their 200 day moving average, bad things seem to happen all around.
Suffice it to say, because of the increased potential for profit during those times of up-trending, risk was much greater than in those periods where the market experienced a downward trend.
Next month we'll look at the risk associated with generating returns, as well as take a look at how the market behaves differently when it is down-trending.
Mike Jones is Managing Director / Investing Group of Argent Advisors, Inc. Email him at mjones@argentmoney.com. Write to him at 500 East Reynolds Drive, Ruston, LA 71270 or call him at (318) 251-5844. The opinions of any single advisor do not necessarily reflect the opinions of Argent Advisors, Inc. No forecasts can be guaranteed. Argent Advisors, Inc. does not offer tax, insurance or legal advice. The information contained in this column should not be construed as a substitute for personalized investment, tax, insurance or legal advice.
Have you met our team?
We have a wealth of experience
in the financial services industry.
