

Investing Truth No. 2: You haven't completely missed the boat!
By Mike Jones, posted September 19th, 2013
Most people think of investing as a personal activity that directly impacts their individual future. However, most of what we are taught is really only applicable to investors en masse, i.e. the market-at-large, and over large periods of time. Over the next several months I will share 10 points that I believe every investor should know prior to committing funds to any investment program.
Last month I discussed secular bull and bear markets and showed how "successful" investing is contingent on your birthday. Recall that when you begin investing--because of the long term cycles experienced in the market--often impacts returns far more significantly than what you invest in.
For some, that may have been very disappointing news. But don't despair... there's still reason for hope!
Before I explain, though, we need to review some market terminology.
Gross Domestic Product (GDP) is a shorthand measure for how the economy is performing. It represents the total dollar value of all goods and services produced over a specific time period - think of it as the size of the economy.
Earnings Per Share (EPS)-the portion of a company's profit allocated to each outstanding share of common stock-serves as an indicator of a company's profitability.
What's that mean to me? you ask. Well, GDP is relevant to all investors because it and EPS are highly correlated (see following chart).
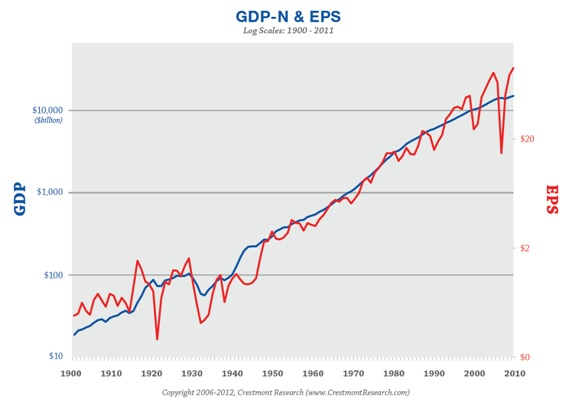
Because of our nation's ongoing population growth and continuing innovation in technology, GDP is very likely to continue to increase, leading to continued growth in corporate profits and EPS.
For investors this means that, regardless of how bearish the market might look at present, it can still be possible to make money.
Ok, Mike, but how much money? you ask. And that's perhaps the bad news. It seems that every time I ask a person what they think a reasonable return on their investments is, the number usually lands in the neighborhood of ten to twelve percent.
But if history has anything to show us, that is, unfortunately, a very unrealistic number.
The following chart shows historical Nominal GDP (that is, GDP that has not been adjusted for inflation) on the left and historical EPS growth on the right, both by decade for the last century.
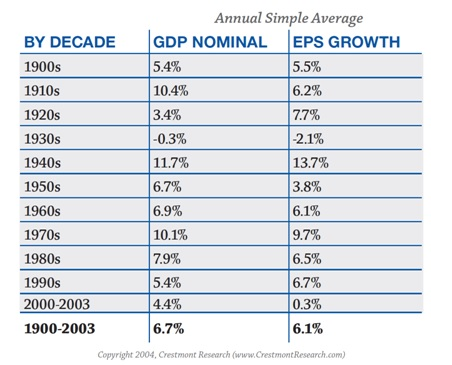
These numbers further depict how GDP and EPS move mostly in tandem. When GDP dropped to -0.3% in the 30s, EPS also saw negative growth. And when the economy bounced back in the 40s, so did EPS.
To summarize, when we look at the annual simple average of each column, you can see that GDP experienced an average annual growth of 6.7%, and EPS growth showed a very similar average of 6.1%.
So, then, where in the world could we have gotten the idea that a reasonable return is 10 to 12%?
The answer is two-part: (1) cherry picking the starting and ending dates for the investing period used to come up with such a positive return and (2) averaging the returns as opposed to calculating a compounded rate of return.
Both of these "tricks" can create unrealistic expectations. Buyer beware.
Mike Jones is Managing Director / Investing Group of Argent Advisors, Inc. Email him at mjones@argentmoney.com. Write to him at 500 East Reynolds Drive, Ruston, LA 71270 or call him at (318) 251-5844. The opinions of any single advisor do not necessarily reflect the opinions of Argent Advisors, Inc. No forecasts can be guaranteed. Argent Advisors, Inc. does not offer tax, insurance or legal advice. The information contained in this column should not be construed as a substitute for personalized investment, tax, insurance or legal advice.
Have you met our team?
We have a wealth of experience
in the financial services industry.
